
Data Warehouse & Business Intelligence
A solution that turns chaos into data, and data into profit
A Data Warehouse (DWH) brings together, organises and stores data from different business systems, while Business Intelligence (BI) turns it into clear reports and analyses.
Together they form a solution that provides complete insight into results and a stable basis for making decisions at every level of the company.

Key benefits
Reports and indicators kept up to date in real time
Fast implementation without disrupting operations
Data Warehouse & Business Intelligence
Challenges in managing data
Generating large volumes of data every day is a natural consequence of a company's growth and stable operations. The problem almost every manager runs into, however, comes from two key operational challenges:
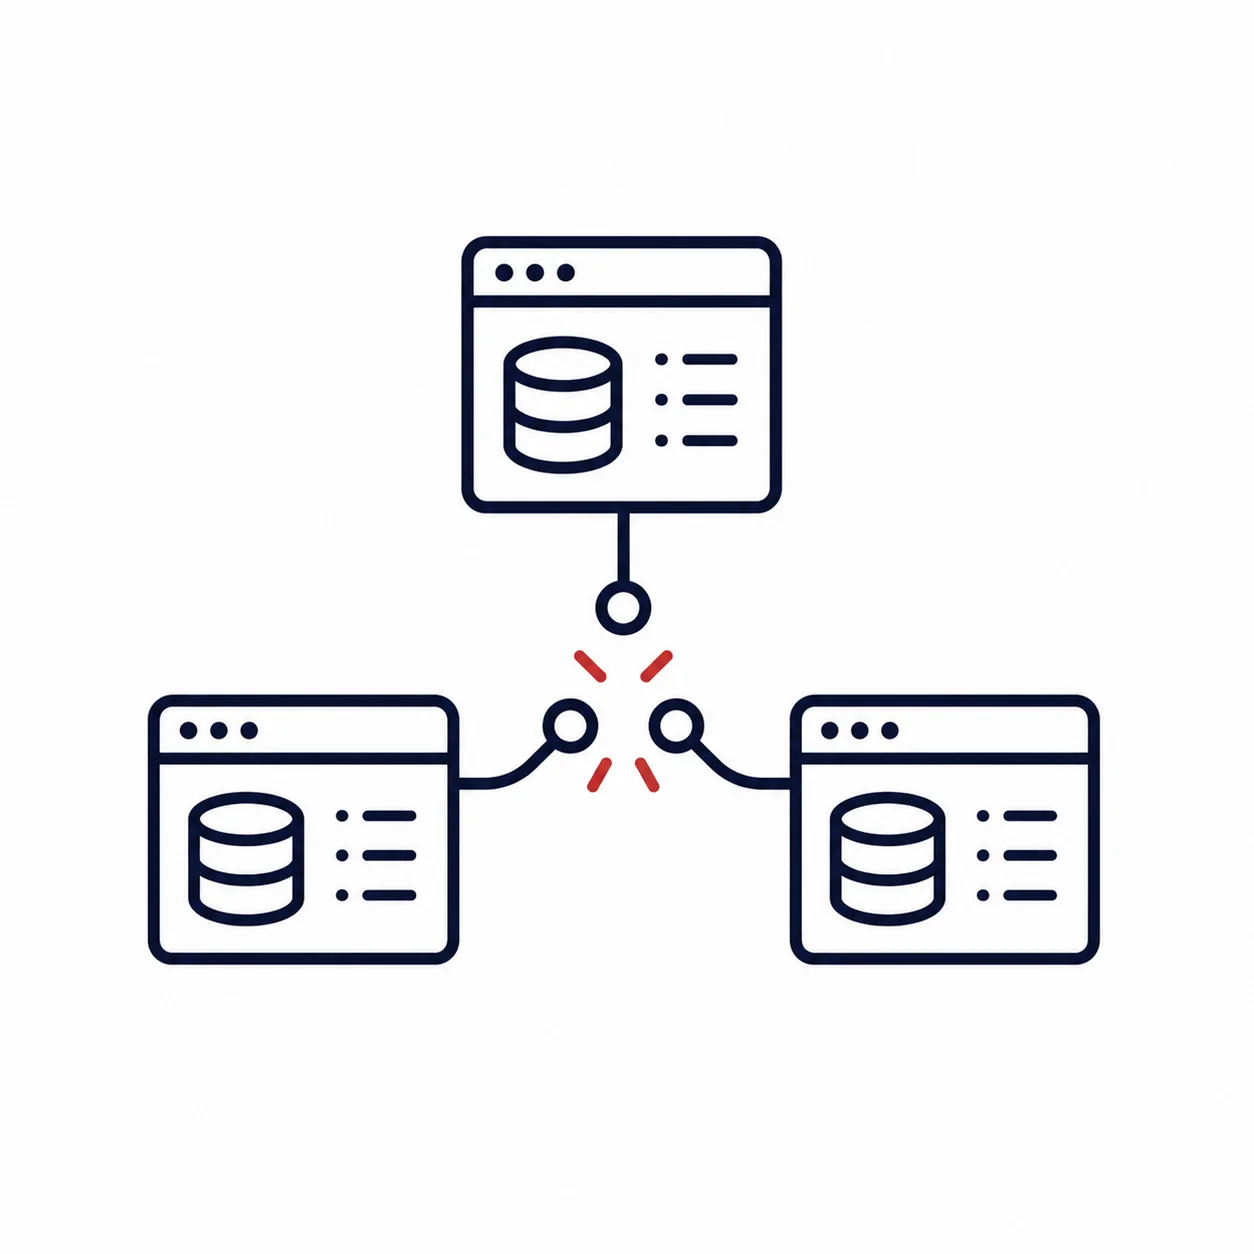
Disconnected business systems
The applications the company uses do not exchange data with one another and do not provide a single view of the business.
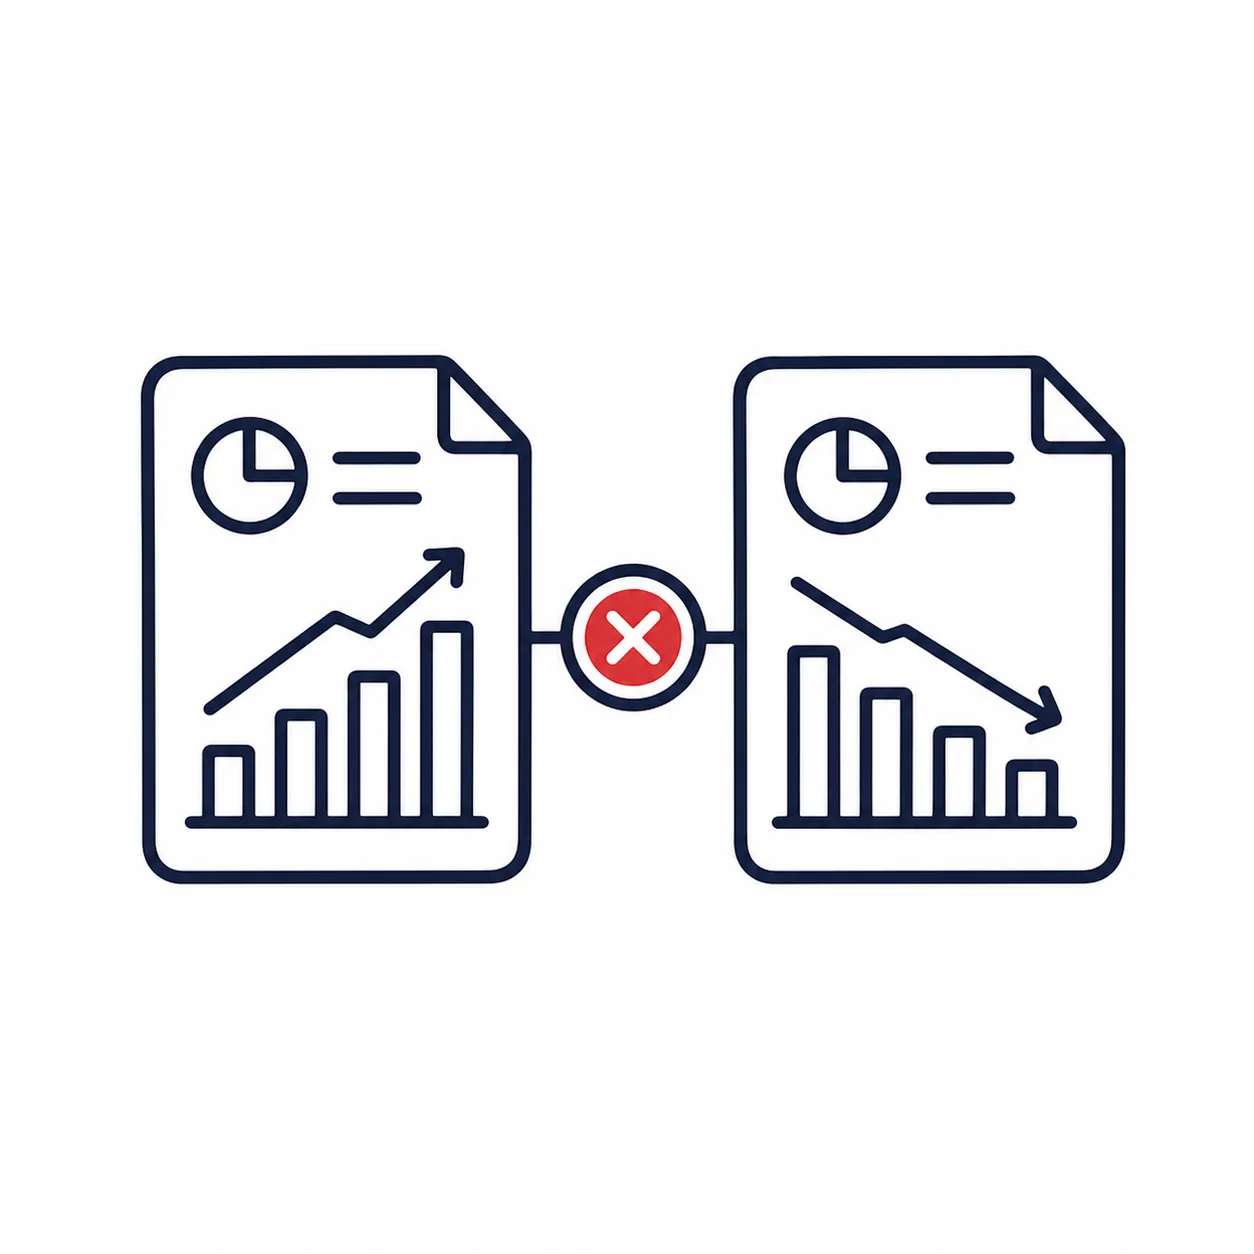
Contradictory results
Inconsistent information and different processing methods can produce different results for the same indicators.
From data to a clear picture of the business
How the system works
Collecting the data
Data from all your business applications, databases, web services and Excel spreadsheets is securely connected and automatically gathered in one place.
-enhanced-aigo.webp)
-enhanced-aigo.webp)
-enhanced-aigo.webp)
-enhanced-aigo.webp)
-enhanced-aigo.webp)
Storage and organisation
Raw information first flows into a Data Lake, which stores data from different sources in its original form. The data is then organised and prepared for storage in the Data Warehouse and Data Marts, in line with the needs of the different business areas.
-enhanced-aigo.webp)
Data Warehouse
-enhanced-aigo.webp)
Data Marts
Analysis and visual presentation
Business Intelligence
Business Intelligence turns the organised data into reports, charts and dashboards that make it possible to track key indicators and business trends.
-enhanced-aigo.webp)
Data Warehouse & Business Intelligence
The business benefits of implementing the solution
01
Greater efficiency and competitiveness
Automating everyday tasks and routine data processing allows time and resources to be used more efficiently.
02
Optimisation of key performance indicators
Continuously monitoring KPIs in real time makes it possible to quickly gauge how well business processes are performing and to pinpoint exactly which areas need action.
03
Detecting (and reducing) risk
Automatic recognition of anomalies, deviations and negative trends enables timely responses and reduces operational and financial risks.
04
A single version of the data
Every department within the company makes decisions based on identical, accurate and cleansed data, which eliminates discrepancies and contradictions between individual reports.
05
Deeper analytics and predictions
Advanced algorithms recognise hidden patterns in historical data and enable more reliable forecasting of future outcomes and market movements.
06
A better decision-making process
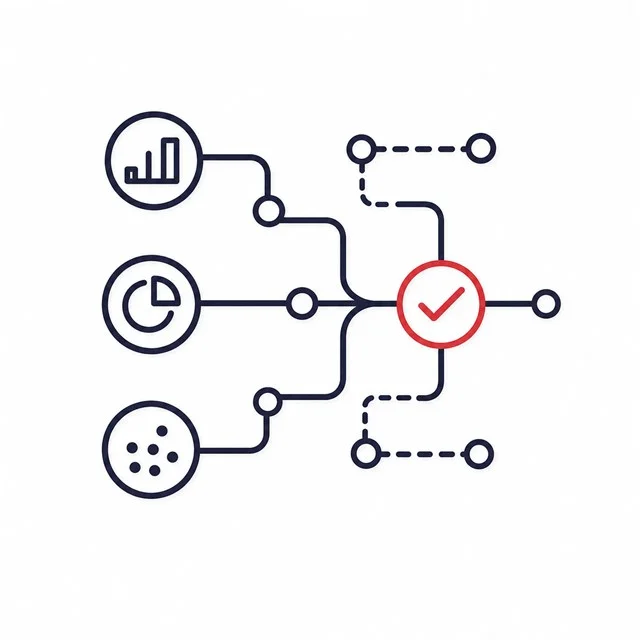
Management's business and strategic decisions are based on accurate, verified data that is available when it is needed.
07
Easier access to and sharing of information
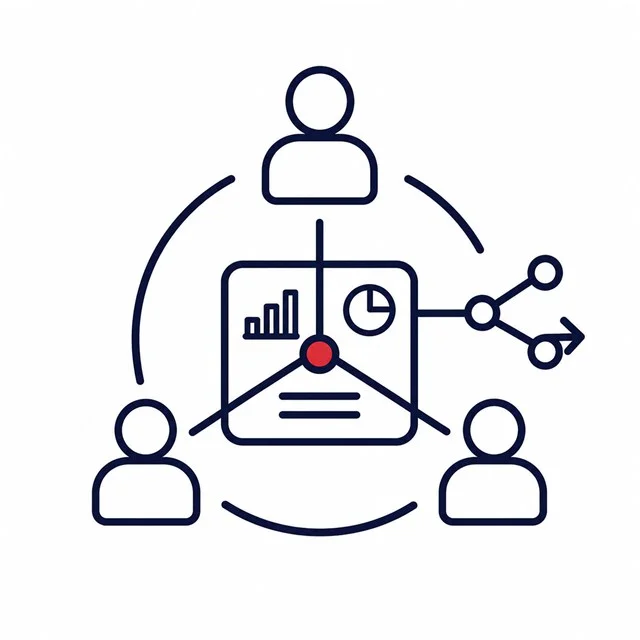
Relevant, approved data is available in one central place, enabling fast and secure exchange of information between different departments.
08
Visualisation
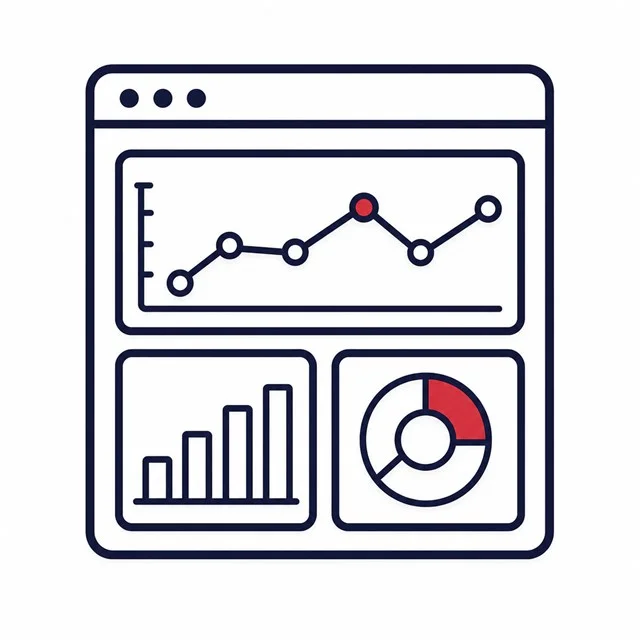
Complex, large data sets are transformed into clear, understandable and interactive charts and dashboards, ready for immediate analysis.
Data Warehouse & Business Intelligence
BI modules for different areas of the business

Controlling, finance and accounting
An overview of revenue, expenses, cash flows, profitability and other financial indicators across different periods, projects, business units and cost centres.

Procurement
Analysis of procurement plans by project, organisational unit and cost centre covers data on suppliers, inventory age and turnover, material consumption and future needs. Estimates are based on past consumption and expected delivery times.

Logistics
Analysis of customer and supplier turnover, ranking of suppliers by various criteria and an overview of open items. The BI module also enables ABC analysis of customers and suppliers, as well as an overview of service profitability.

Project tracking
An overview of planned and completed activities by project phase, including deadlines, resources, budgets and staff involvement. Procurement costs, suppliers and subcontractors can be analysed for each project individually as well as across all projects.
Warehouse operations
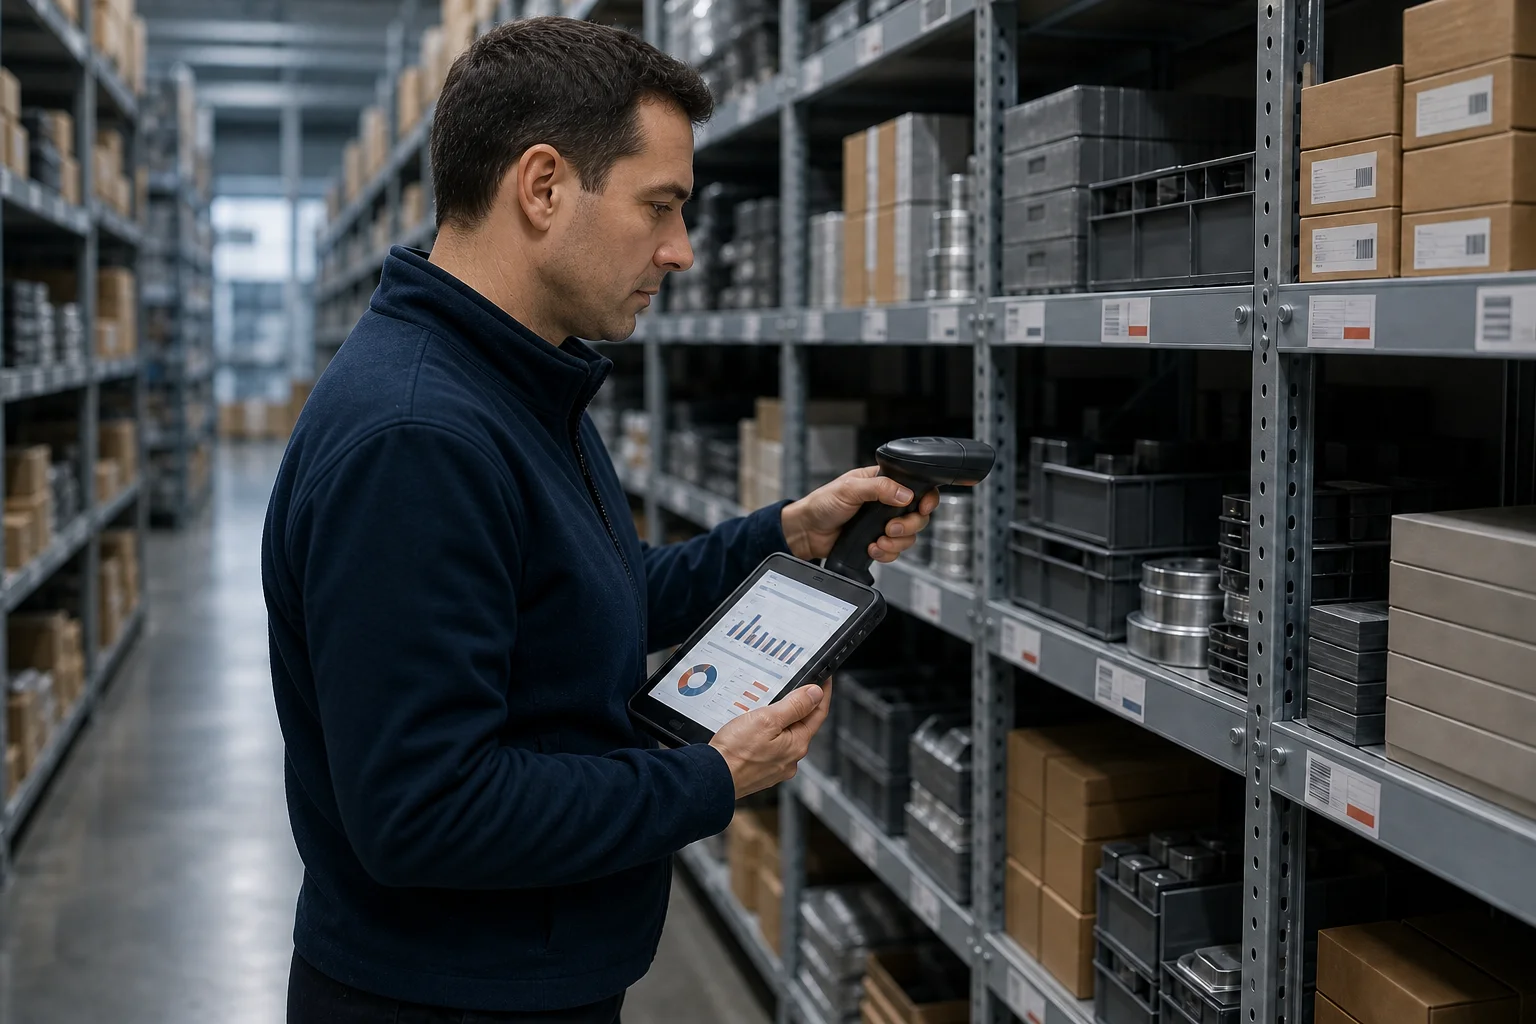
An overview of inventory levels, age and turnover by supplier, product group, brand, project and cost centre. Based on past consumption and planned needs, the system supports forecasting future procurement and setting minimum and maximum inventory levels.
Data Warehouse & Business Intelligence
The solution starts from your data and your needs
Not every company uses the same applications, data sources and indicators. That is why we shape the DWH and BI solution around each company's existing systems and ways of working.
1
Situational analysis
We analyse which data the company collects, which databases and software solutions it uses, what reporting currently looks like and the problems users are running into.
2
Needs analysis
We define which information should be available through the new system, who will use it, which existing solutions need to be connected and what support users will need.
3
Building tailored dashboards
We build reports, charts and dashboards tailored to your business needs, indicators and goals.
4
User training
We train employees to use the reports, charts and dashboards correctly and independently in their day-to-day work.
Data Warehouse & Business Intelligence
Examples from practice
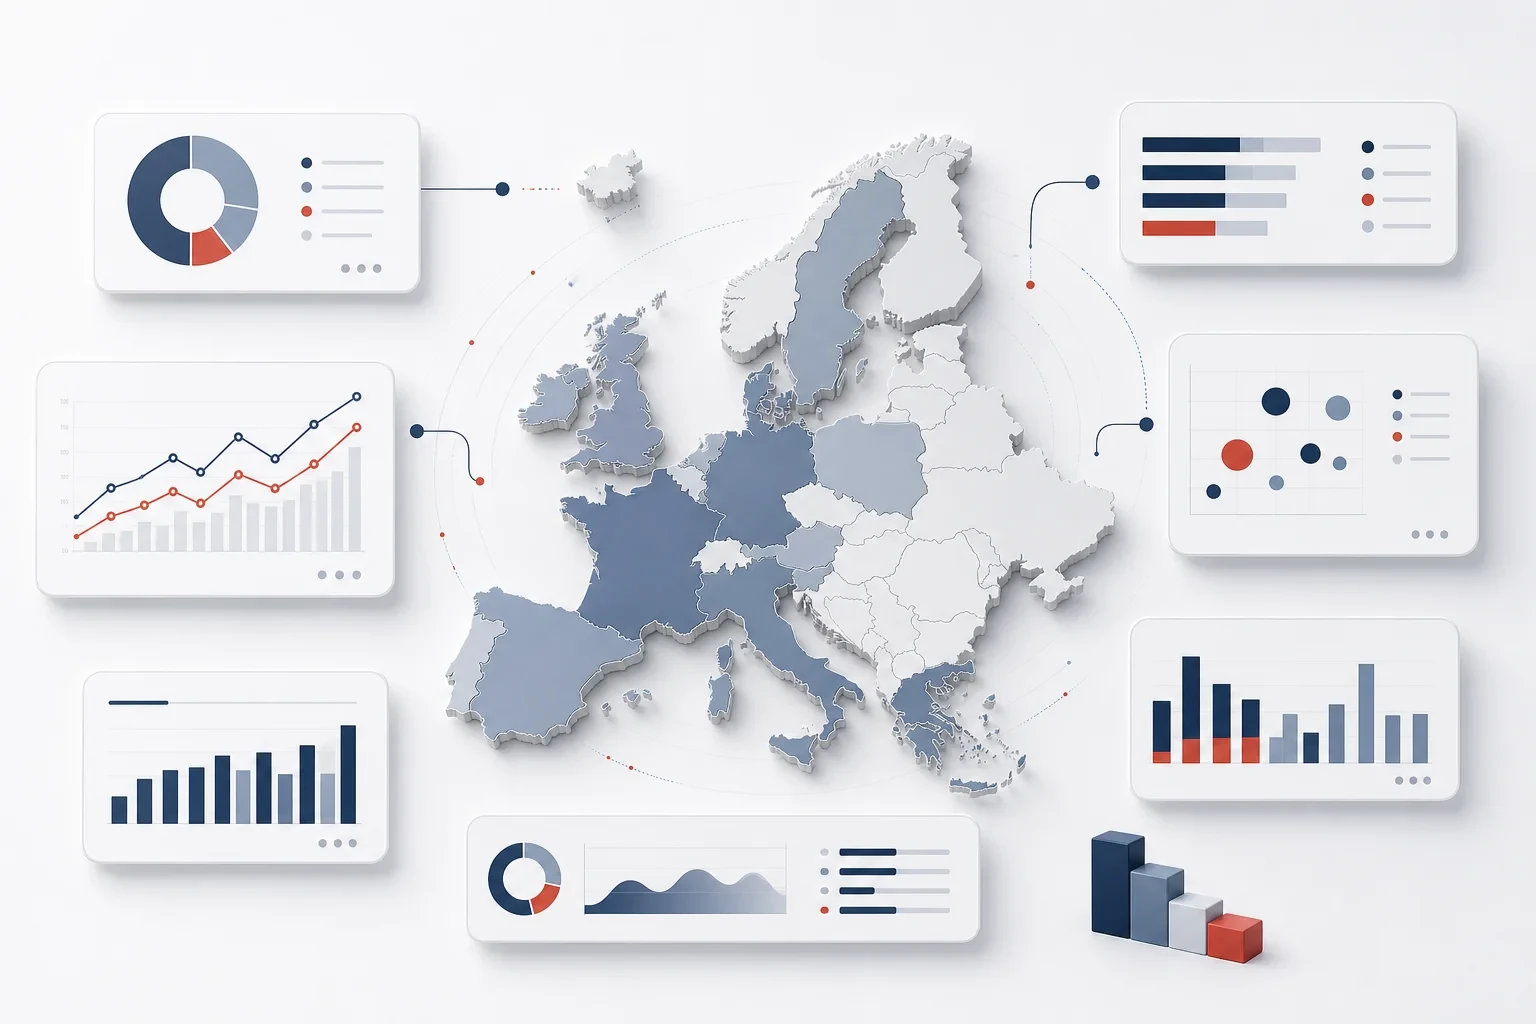
Analysis of the European Union market
For the Western Balkans 6 Chamber Investment Forum, a digital BI platform was developed that brings together data from various international sources and enables analysis of the European Union market by country and by industry.
The platform was used to prepare the export strategies of Western Balkans companies and to familiarise them with the regulations and the opportunities for entering the European Union market.
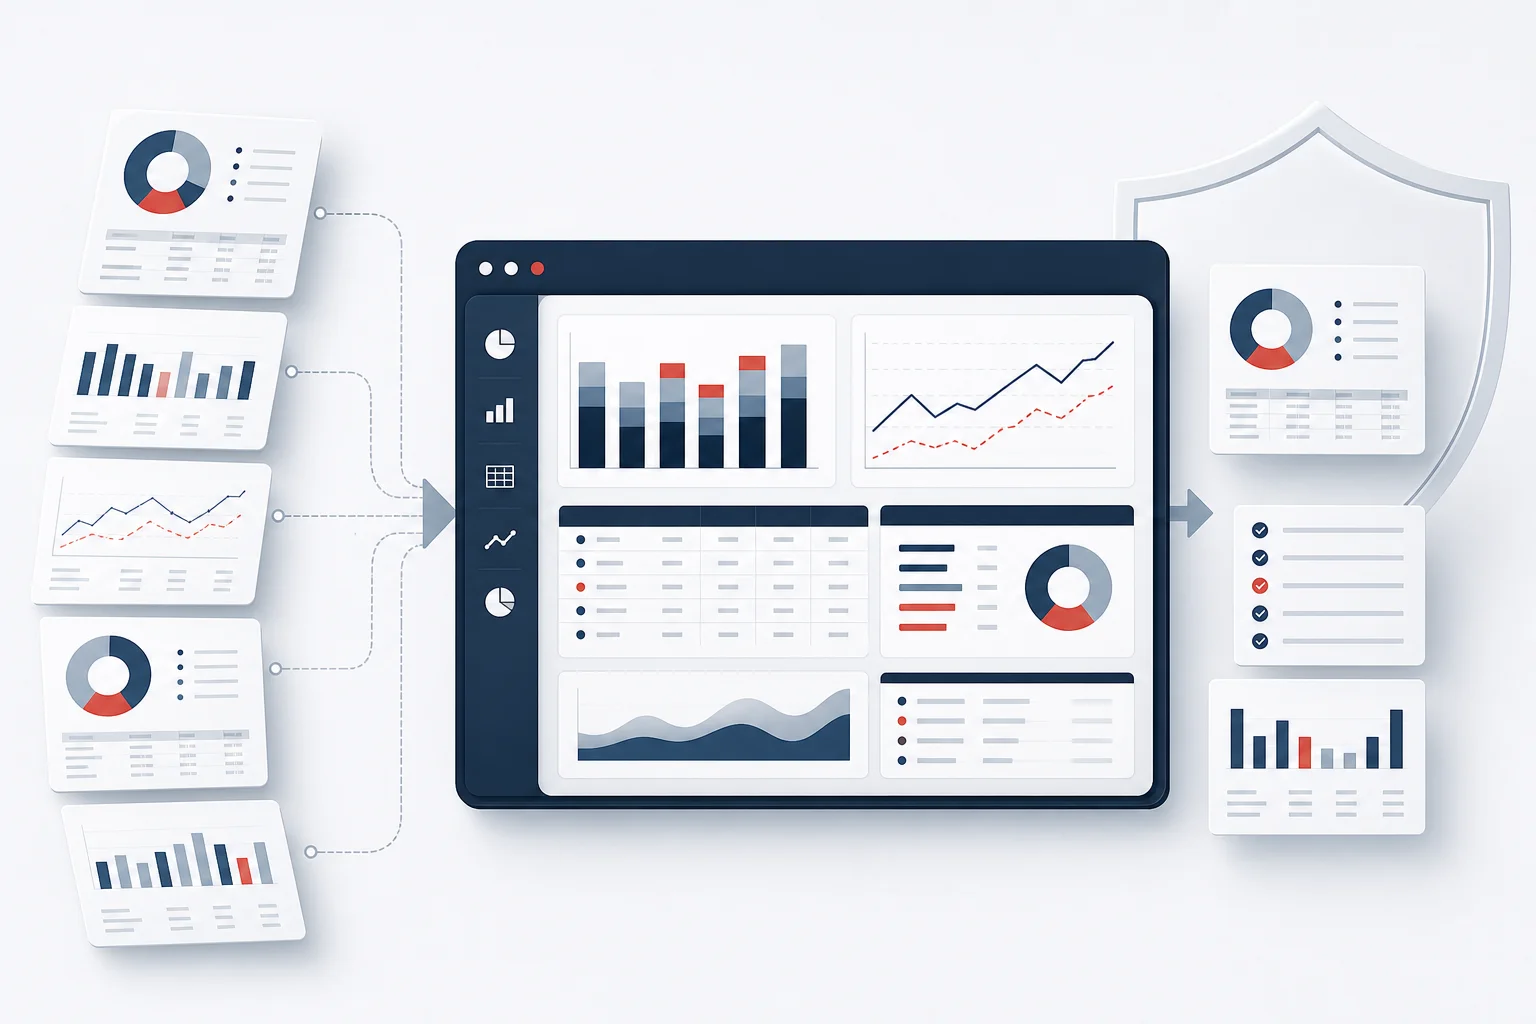
Reporting for insurance companies
A solution was developed for fast, precise analysis of insurance companies' financial statements and for reporting to the National Bank of Serbia.
The solution provided more clearly defined data as a basis for organising, planning and controlling business processes.
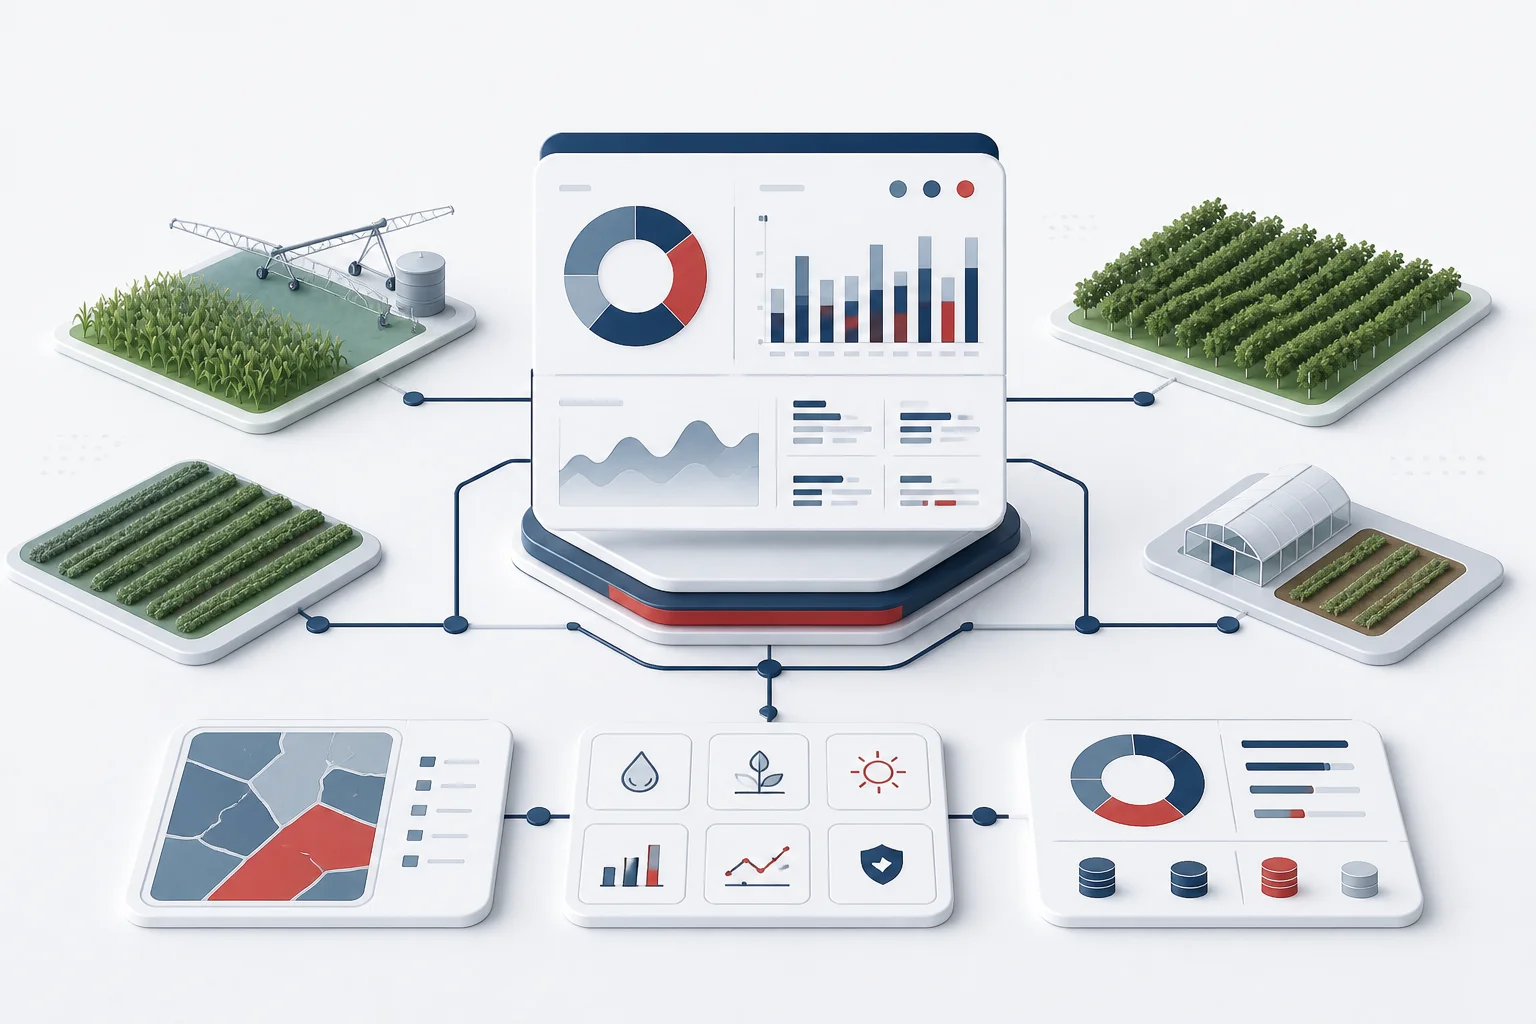
Agricultural information platform
As part of the development of the Serbian agricultural information and reporting platform, a centralised view of data was established for analysis, evaluation, planning and budgeting.
The solution made it possible to make decisions and shape policy on the basis of reliable data important for the development of Serbia's agricultural sector.